")
Turning Complex Data into Actionable Insights to Combat Environmental Crime
Environmental crime, from illegal dumping of toxic waste in remote locations to unregistered exports of electronic material, has grown in scale across Europe. At the moment investigators must piece together national registry spreadsheets, Eurostat tables and sporadic satellite or field reports. This manual effort can take days or weeks before any trends emerge. To get ahead of these threats PERIVALLON is developing a platform to bring all relevant sources together and deliver clear, tailored intelligence to each user group without delay.
By transforming raw inputs into interactive dashboards, the PERIVALLON platform does more than display numbers. It guides border guards, environmental inspectors, forensic analysts and policymakers directly to the anomalies that warrant follow‑up.
DRAXIS’ Visualization Tool within PERIVALLON
Dataset integration drove DRAXIS to embed a dedicated visualization module inside the PERIVALLON platform. This module makes two essential Eurostat datasets both accessible and actionable, eliminating manual data wrangling and speeding up decision‑making.
Waste electrical and electronic equipment (WEEE) by management operation
This dataset tracks how electronic and electrical waste is collected, treated and disposed across Europe. By visualizing WEEE flows by time period, unit of measure, country, category and waste management operations, users can quickly identify anomalies or trends that may indicate illegal activities.
Production and consumption of chemicals by hazard class
This dataset details the amounts of hazardous chemicals produced and consumed in EU countries, classified by hazard type (e.g. carcinogenic, toxic). Visualizations help stakeholders detect unusual spikes or patterns in hazardous chemical flows that could signal environmental crime or regulatory non-compliance.
From Raw Data to Rapid, Targeted Reporting
Workflow overview within the PERIVALLON visualization tool takes users from an initial, often overwhelming mass of raw data through an intuitive filtering process, and finally into clear, targeted visualizations.
Raw Data Visualization
Figure 1 displays a chaotic chart showing raw WEEE data before any filtering – illustrating the complexity of unprocessed dataset.
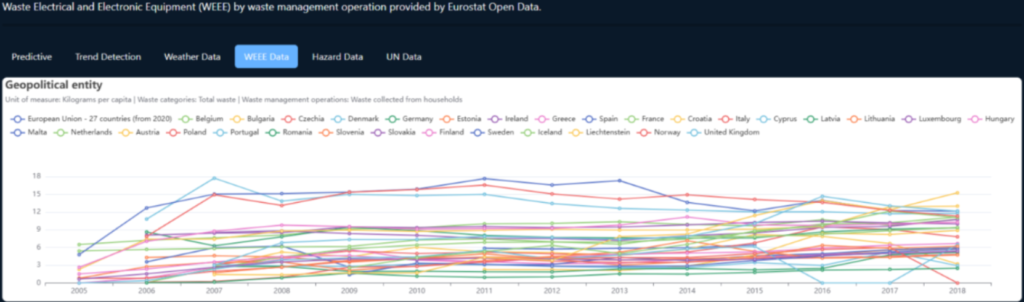
Figure 1: Raw WEEE flows by EU country (2005-2018)
User’s parameter selection
The PERIVALLON visualization tool enables users to filter and analyze these datasets effortlessly. The interface guides users through selecting a year range, country, unit of measure, waste category and management operation so they can focus on the data points that matter most to their mission.
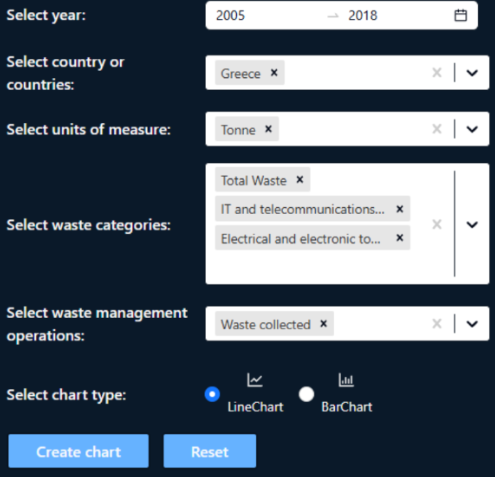
Figure 2: Sample filter configuration in the PERIVALLON tool
Processed chart visualization based on the selected parameters
With just a few clicks, law enforcement officers, inspectors, policymakers and researchers can select the parameters they need and instantly generate clear and customized visual reports – no technical expertise required.
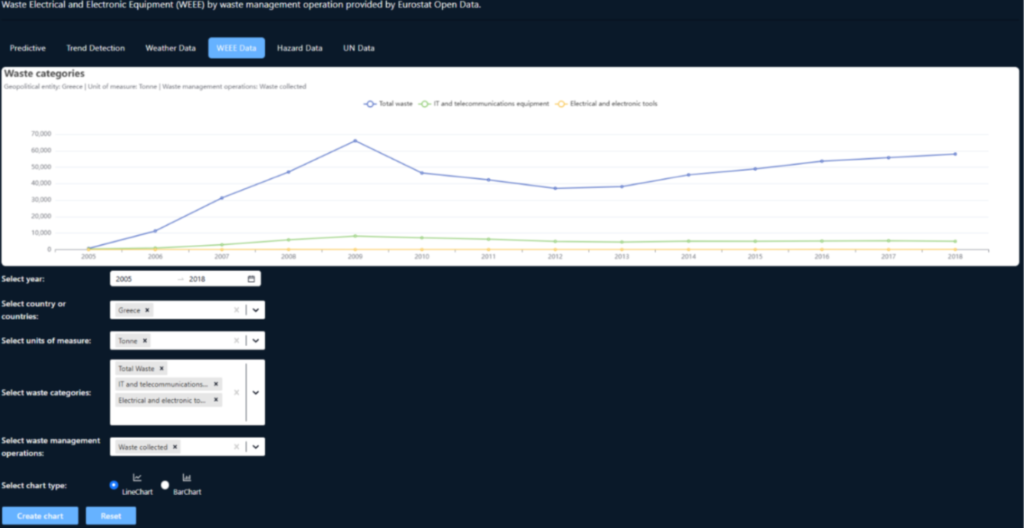
Figure 3: Filtered WEEE trends for multiple EU countries (2005–2018)
Focusing on these two key datasets enables faster and better informed decisions for detecting, investigating and preventing environmental crime across Europe.
Written by George Kalantzis
DRAXIS Environmental S.A.